How to Read a P&L Statement: A Complete Guide for Business Owners (2026)
TL;DR
A profit and loss (P&L) statement also called an income statement shows how much money your business made and spent over a specific period, and whether the result was a profit or a loss. It follows a simple structure: revenue at the top, cost of goods sold (COGS) subtracted to get gross profit, operating expenses subtracted to get operating profit, then taxes and interest subtracted to get net profit (the bottom line).
To read a P&L well, you don’t just look at whether the bottom line is positive, you look at the relationships between the numbers: gross margin, operating margin, expense ratios, and how each line compares to the prior period and to your budget. A P&L that shows growing revenue but shrinking margins is telling you something very different from one showing flat revenue but expanding margins. This guide walks through the full structure of a P&L statement, explains what each line actually means for a small business, and shows the specific ratios and red flags that separate business owners who use their P&L from those who just file it.
What is a P&L statement?
Quick answer: A profit and loss statement (P&L) is a financial report that shows your business’s revenue, expenses, and resulting profit or loss over a specific period of time typically a month, quarter, or year. It’s one of the three core financial statements alongside the balance sheet and cash flow statement, and it’s the single best snapshot of whether your business is making money.
A P&L statement answers one fundamental question: over the last month (or quarter, or year), did your business make money or lose money? It doesn’t tell you what you own or owe (that’s the balance sheet), and it doesn’t tell you what actually hit your bank account (that’s the cash flow statement). It tells you whether the economic activity of the business sales generated, costs incurred produced a profit.
The terms “P&L” and “income statement” mean exactly the same thing. Larger companies and accountants tend to say “income statement.” Small business owners and lenders tend to say “P&L.” Both refer to the same report. If your bookkeeper hands you an “income statement” and your CPA asks for a “P&L,” they’re asking for the same document.
What makes the P&L uniquely useful is that it’s the statement that shows cause and effect over time. A balance sheet is a snapshot at a single moment; a P&L is a movie. It shows what your business did to generate revenue, what it cost to do that, and what was left over. When something is going wrong in a business, the P&L is almost always where the first signal shows up, usually as a margin compression before it ever becomes a cash problem.
What’s on a P&L statement?
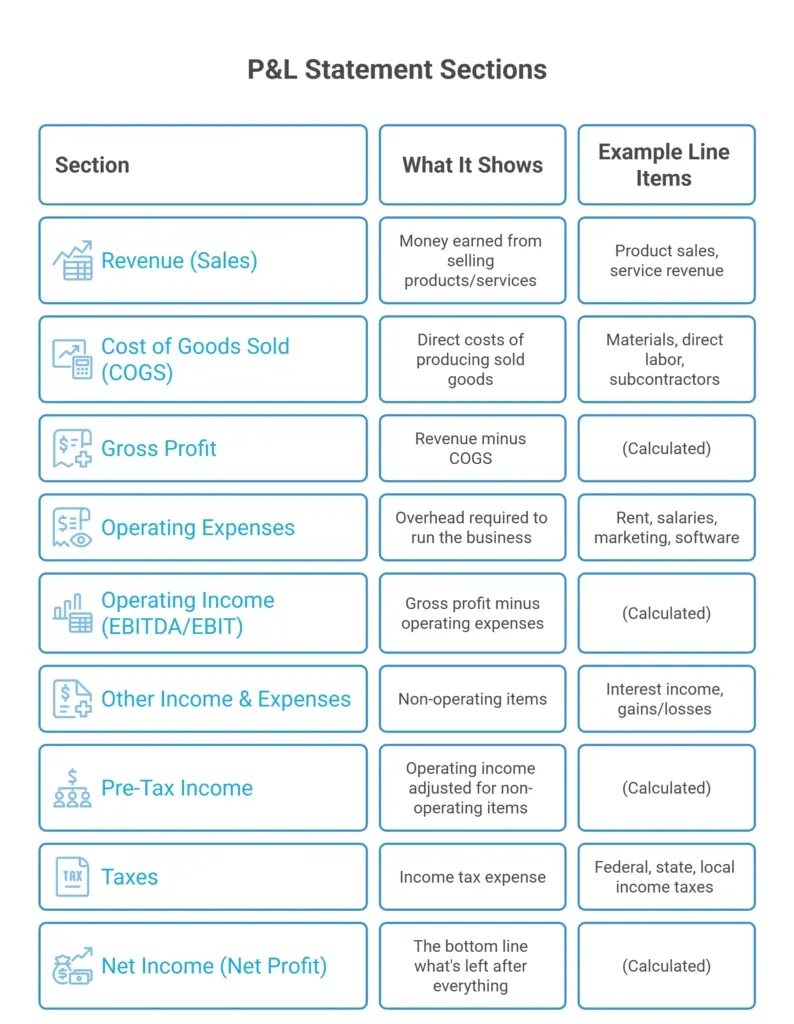
Quick answer: A P&L statement has five main sections stacked top to bottom: revenue (money earned), cost of goods sold (direct costs of delivering revenue), gross profit (revenue minus COGS), operating expenses (overhead like rent, salaries, marketing), and net income (the bottom line after everything, including taxes and interest, is subtracted).
The standard P&L structure
An example P&L for a small service business
Here’s what a simplified P&L might look like for a small business generating $1M in annual revenue:
| Line | Amount | % of Revenue |
| Revenue | $1,000,000 | 100% |
| Cost of Goods Sold | ($350,000) | 35% |
| Gross Profit | $650,000 | 65% |
| Operating Expenses | ($450,000) | 45% |
| Operating Income | $200,000 | 20% |
| Interest Expense | ($10,000) | 1% |
| Pre-Tax Income | $190,000 | 19% |
| Taxes | ($45,000) | 4.5% |
| Net Income | $145,000 | 14.5% |
Every P&L follows this structure, but the labels vary. Some businesses call revenue “sales” or “gross receipts.” Some break COGS into subcategories. Some separate operating expenses into “sales and marketing,” “general and administrative,” and “research and development.” Larger companies add lines for depreciation, amortization, and non-operating items. The underlying logic is always the same: start with money in, subtract the cost of earning it, subtract the cost of running the business, and end with what’s left over.
What matters more than knowing every possible line item is understanding the structure: revenue → gross profit → operating income → net income. Once you can walk down those four numbers on any P&L, you can read any financial statement a business hands you.
How do you read a P&L statement step by step?
Read a P&L in this order:
- Start with revenue and compare it to the prior period.
- Check gross profit and gross margin percentage.
- Look at operating expenses as a percentage of revenue.
- Confirm operating income.
- End at net income but don’t stop there.
Always compare current period to prior period and to budget, because a single number in isolation tells you almost nothing.
The five-step process
Step 1 Start at the top with revenue: Is it higher or lower than last period? By how much? Growing revenue is good, but the rate of growth tells you that 5% growth in a business that grew 40% last year is a warning; 5% growth in a mature business growing off a stable base is fine.
Step 2 Calculate gross margin: Divide gross profit by revenue. This is the percentage of every revenue dollar you keep after paying to deliver the product or service. Track it every period. Gross margin compression (the number shrinking) is one of the earliest indicators that pricing is losing to costs and it usually shows up here before it shows up anywhere else.
Step 3 Look at operating expenses as a percentage of revenue: Rising operating expenses aren’t automatically a problem if revenue is rising faster. But if OpEx is growing as a percentage of revenue, the business is getting less efficient; you’re spending more overhead per dollar earned.
Step 4 Check operating income: This is the truest measure of whether the core business is profitable, because it strips out non-operating items like interest and one-time gains. If operating income is positive and growing, the underlying business is healthy. If it’s shrinking or negative, no amount of financial engineering below the line will fix it.
Step 5 End at net income, but don’t over-index on it: Net income is the bottom line, but it can be distorted by one-time items, tax timing, and non-operating gains or losses. It matters but the story of the business lives in the lines above it.
The comparison that matters
Reading a P&L in isolation is like reading a single frame of a movie you can see what’s happening, but not what it means. Every number on a P&L should be compared against three benchmarks:
- Prior period (month-over-month or year-over-year): Is it moving in the right direction?
- Budget or forecast: Are you hitting your plan?
- Industry benchmark: Are your margins competitive for your industry?
Most small business owners we work with never look at the second or third comparison, which is why our Controller Services engagements almost always start with the same fix: producing P&Ls that include prior-period and budget columns side by side. It’s a small format change that transforms a P&L from a historical record into a decision-making tool.
What’s the difference between gross profit, operating profit, and net profit?
Gross profit is revenue minus direct costs (COGS), it shows how much you keep from each sale before overhead.
Operating profit is gross profit minus operating expenses (rent, salaries, marketing), it shows whether the core business makes money.
Net profit is operating profit minus everything else (interest, taxes, one-time items), it’s the true bottom line and the number that hits retained earnings.
The three profit numbers, explained
Each profit number tells you something different, and they can move in opposite directions in the same period. Here’s what each one actually reveals:
Gross Profit: “How profitable is our product or service, before we account for the cost of running the business?” If a business has a high gross margin, it means the product or service is priced well above what it costs to deliver there’s room to cover overhead and still make a profit. Software companies typically have gross margins of 70 – 90% (very cheap to deliver each additional unit). Construction and manufacturing typically have 20 – 40% (labor and materials eat a lot of each dollar). Services vary widely.
Operating Profit: “Is the core business actually profitable when we include the cost of running it?” This is the number most sophisticated financial analysts focus on because it strips out financing decisions (interest) and tax situations (which vary by structure and state) and shows just how well the business itself is performing. Two identical businesses with different capital structures will have the same operating profit but different net profits.
Net Profit (Net Income): “After literally everything, how much did we make?” This is the number that flows to retained earnings on the balance sheet, that gets taxed, and that’s used to calculate profitability ratios like return on equity. It’s the truest bottom line, but it can be distorted by one-time items such as a lawsuit settlement, an asset sale, a tax refund that does not reflect the ongoing health of the business.
Why the three numbers can tell different stories
A business can have a strong gross profit but negative operating profit. The product is profitable, but overhead is out of control. A business can have positive operating profit but negative net profit. The business itself makes money, but interest on debt is eating everything. A business can have a great net profit that’s entirely driven by a one-time gain on an asset sale, while the underlying business is losing money.
The pattern we see most often in the field: a business owner celebrates a positive net profit without noticing that operating profit has been shrinking for three quarters in a row. The net number is being propped up by non-operating items or tax timing. Six months later, when those cushions ran out, the business faced a sudden loss that “came out of nowhere” but it was visible on the P&L the whole time, in the operating income line.
How do you analyze a P&L statement?
Quick answer: Real P&L analysis isn’t about looking at the numbers, it’s about calculating ratios and comparing them across time. The four ratios that matter most are gross margin (%), operating margin (%), net margin (%), and revenue growth rate (%). Once you’re tracking those four numbers period over period, you can see the health of your business at a glance and spot problems before they become crises.
The four ratios every business owner should track
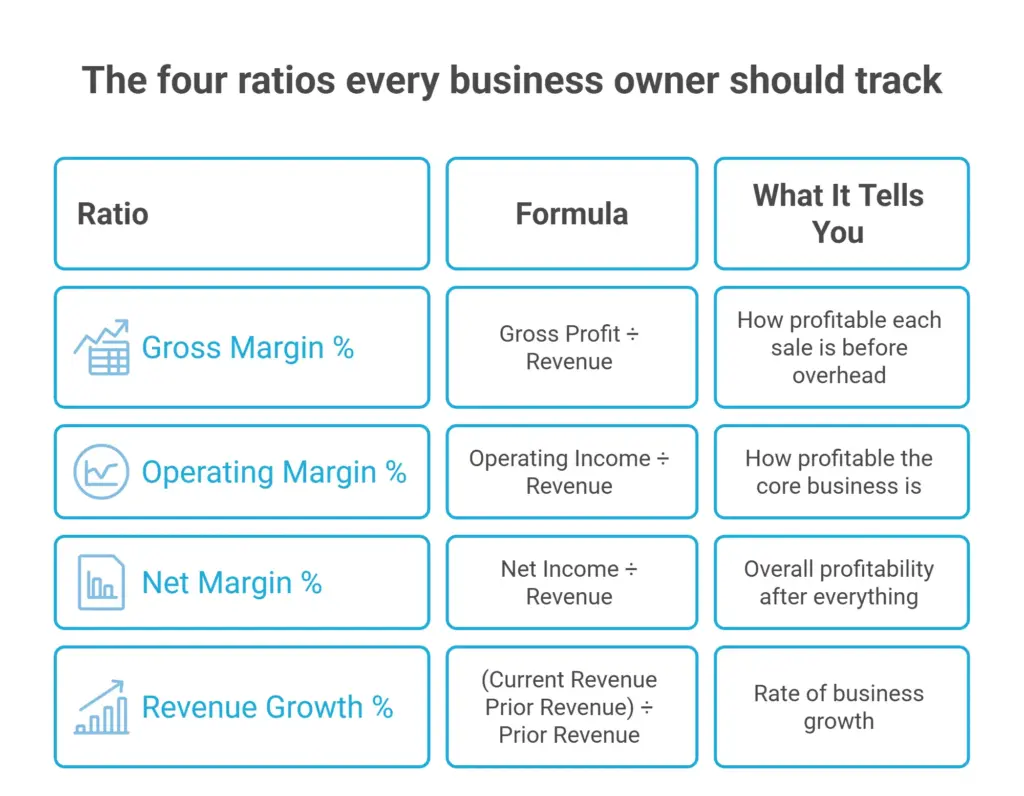
Tracked over time monthly on a rolling twelve-month basis is ideal, these four numbers give you a health dashboard for the business. A business with rising revenue, stable margins, and controlled growth is healthy. A business with rising revenue but falling margins is scaling unprofitably. A business with falling revenue but stable margins is contracting but not bleeding. A business with falling revenue and falling margins needs immediate attention.
Vertical analysis: reading a P&L in percentages
Vertical analysis means expressing every line on the P&L as a percentage of revenue. That’s why the example P&L above included a “% of Revenue” column; it’s the most useful way to read the report.
Vertical analysis normalizes the numbers so you can compare across periods when revenue changes. Rent going from $50K to $60K might look bad in absolute terms, but if revenue grew from $500K to $800K in the same period, rent actually shrank as a percentage of revenue (10% down to 7.5%). Without vertical analysis, you can’t tell whether expense growth is proportional to business growth or eating into margins.
Horizontal analysis: reading a P&L across time
Horizontal analysis compares the same line items across multiple periods, this month vs. last month, this quarter vs. last quarter, this year vs. last year. It’s what shows you trends. Gross margin down two months in a row is a coincidence; gross margin down five months in a row is a pattern that needs a root cause analysis.
A properly built P&L report combines both vertical analysis (percentages) and horizontal analysis (multiple periods side by side). That’s the format we build for our Financial Reporting clients, because it’s the format that turns a P&L from a compliance document into a management tool.
What are the P&L red flags every business owner should watch for?
Quick answer: The most important P&L red flags aren’t single bad numbers, they’re trends in the ratios. Watch for gross margin compression (three or more months of declining gross margin), operating expense creep (OpEx growing faster than revenue), revenue growth slowdown (declining growth rate even if revenue is still growing), and reliance on non-operating income to hit net profit targets.
The five red flags that matter most
1. Gross margin compression: If your gross margin is dropping period over period, one of three things is happening: your costs are rising, your pricing is falling, or your product mix is shifting toward lower-margin work. All three are fixable, but only if you catch them. Three consecutive months of declining gross margin is the point where investigation should start; five months is the point where action should already be underway.
2. Operating expense creep: OpEx should grow more slowly than revenue over time, that’s what operating leverage looks like. If OpEx is growing as fast as or faster than revenue for multiple periods, the business is losing efficiency. Common culprits: headcount growing ahead of revenue, software subscriptions accumulating, professional fees expanding without oversight.
3. Revenue growth deceleration: A business growing 30% one year, 20% the next, and 12% the year after is decelerating even though absolute revenue is still going up. That trend line, if untreated, ends at zero growth or contraction. The earlier you see the deceleration, the more time you have to address it.
4. Non-operating income masking operating losses: If your net profit is positive but your operating profit is negative (or shrinking), the business is being kept afloat by items that aren’t sustainable interest income on cash reserves, asset sales, tax refunds, insurance settlements. Once those run out, the operating losses hit the bottom line.
5. Missing budget consistently: A single miss is noise. Three consecutive misses is a signal. The gap between actual and budget on your P&L is telling you either that your budget was unrealistic (a planning problem) or that execution is off (an operations problem). Either way, it needs a response.
What we typically see when we start with a new client
The most common pattern we see when we take over a new client’s books is a P&L that hasn’t been properly analyzed in months, sometimes years. The bookkeeper is producing a monthly P&L, the owner is glancing at the bottom line, and no one is calculating margins, comparing to budget, or watching the ratios trend over time. When we run the numbers back six or twelve months, we can usually identify the exact month when things started shifting and the owner had no idea. The P&L was there; the analysis wasn’t. That’s the gap between having financial reports and using them.
How often should you review your P&L?
Small business owners should review a P&L monthly no less. Fast-growing or high-transaction businesses should review it twice a month or weekly. Businesses with significant seasonality should review both current month and rolling twelve-month numbers to smooth out timing effects. Annual review is far too infrequent to catch problems while they’re still fixable.
The monthly cadence isn’t arbitrary, it’s driven by how quickly problems compound. Gross margin compression that started in January but isn’t noticed until the annual review in March of the following year is 14 months of eroded profit that could have been addressed in month two. Monthly review of a properly-formatted P&L (with prior period and budget columns) catches those trends when they’re still small enough to fix without a crisis.
The other reason for monthly review is that the P&L is only as good as the books underneath it. Businesses that only look at financials quarterly or annually almost always have bookkeeping problems because there’s no ongoing review, errors compound. Businesses that review monthly force the books to be closed cleanly every month, which improves the underlying data quality across every financial report.
What’s the difference between a P&L, balance sheet, and cash flow statement?
The P&L shows profit over a period of time (revenue minus expenses). The balance sheet shows what you own and owe at a single point in time (assets, liabilities, equity). The cash flow statement shows how cash actually moved in and out of the business (which is different from profit because of accrual accounting). All three together give the complete financial picture. No single one is enough on its own.
The three-statement summary
| Statement | Question It Answers | Time Frame |
| P&L (Income Statement) | Did we make or lose money? | Period (month, quarter, year) |
| Balance Sheet | What do we own and owe? | Point in time (a specific date) |
| Cash Flow Statement | Where did cash actually come from and go? | Period (month, quarter, year) |
The P&L is the one most business owners look at, but it’s incomplete on its own. A business can be profitable on the P&L and still run out of cash (if customers pay slowly or inventory ties up cash). A business can look strong on the balance sheet but be losing money on the P&L (if it’s spending down accumulated assets). A business can generate strong cash flow but be unprofitable (if it’s collecting deposits for future work).
Reading all three together is what separates real financial analysis from the surface-level version. This is where a controller or an outsourced controller like our Controller Services team earns their keep: not producing the reports, but interpreting all three together to tell you what’s actually happening in the business.
How Breakwater helps you actually use your P&L
Producing a P&L is easy. QuickBooks Online can generate one with a single click. Producing a P&L that’s actually usable for decisions is a different job. That’s where Breakwater comes in.
Our Outsourced Bookkeeping Services team makes sure the numbers underneath your P&L are accurate proper reconciliations, correct categorization, and monthly close on time. Without that, the P&L is unreliable no matter how it’s formatted.
Our Financial Reporting service builds P&Ls in the format that makes them useful: vertical analysis columns (percentages), horizontal analysis columns (prior period, prior year, budget), and the KPIs that matter for your specific business. It’s the difference between a P&L you file and a P&L you actually read.
Our Controller Services layer expertise on top walking through the P&L with you each month, calling out the trends that matter, flagging the red flags before they become crises, and making sure the numbers roll up into board-ready or lender-ready reports when you need them.
All of it runs on QuickBooks Online, where every member of our team is a certified QuickBooks Online ProAdvisor, and we can help build or optimize your tech stack through our Technology + Workflow Consultants team if the reporting problem starts with the systems.
Ready to turn your P&L into a real management tool?
Breakwater’s outsourced accounting team builds and interprets financial reports that actually help you run your business, not just file them away. Schedule a consultation
Frequently asked questions
There is no difference between “P&L statement” and “income statement” , two names for the same report. “P&L” (short for “profit and loss”) tends to be used by small business owners and lenders, while “income statement” tends to be used by accountants and public company filings. Both refer to the report that shows revenue, expenses, and profit or loss over a period of time.
No and this is one of the most common misunderstandings among business owners. A P & L uses accrual accounting, meaning it records revenue when it’s earned (not when cash arrives) and expenses when they’re incurred (not when cash goes out). A cash flow statement tracks actual cash movement in and out of bank accounts. A business can be profitable on the P&L and still run out of cash which is why you need both reports.
If you’re using accounting software like QuickBooks Online, Xero, or FreshBooks, the P&L is generated automatically from your bookkeeping data; you just select the date range. If you’re doing it manually, you list revenue at the top, subtract cost of goods sold to get gross profit, subtract operating expenses to get operating income, subtract interest and taxes, and end with net income. But manual P&Ls are error-prone at any scale accounting software is worth the cost even for very small businesses.
It varies enormously by industry. Software and SaaS businesses often run 15–25% net margin. Professional services businesses run 10 – 20%. Retail and restaurants often run 3 – 8%. Construction and manufacturing vary widely by segment. The best benchmark isn’t a universal number, it’s your own margin over time (is it stable or shrinking?) and comparable businesses in your industry.
For internal management, accrual basis is almost always better, it matches revenue to the period it was earned and expenses to the period they were incurred, giving you a truer picture of business performance. For tax purposes, some small businesses can file on a cash basis, which is simpler. Many businesses maintain accrual books for management and convert to cash for tax filing. This is a conversation to have with your CPA and outsourced accounting team.
At minimum, compare current month to prior month and to same month prior year (to control for seasonality). For deeper analysis, look at rolling twelve-month totals, this smooths out monthly noise and shows the underlying trend. Businesses in fast-moving industries should also compare quarter-over-quarter to catch trends earlier than annual comparisons would show.
One-time items are revenue or expenses that aren’t part of ongoing operations for example, gains on selling equipment, insurance settlements, lawsuit costs, restructuring charges, or PPP loan forgiveness. They’re worth calling out separately because they distort the picture of ongoing business performance. A P&L with $200K of net income that includes $180K from a one-time gain isn’t the same story as a P&L with $200K from operations.
Yes, that’s part of why we wrote this guide. The five-step reading process (revenue → gross profit → operating expenses → operating income → net income), plus the four key ratios (gross margin, operating margin, net margin, revenue growth), are all you need to read any P&L meaningfully. The deeper analysis (segment reporting, unit economics, cohort profitability) is where an accountant or controller adds value, but the top-line read is entirely accessible without an accounting background.
The P&L becomes a decision-making tool when you use it prospectively, not just historically. Compare actual to budget every month the variances tell you where the business is running hot or cold. Track your four core ratios monthly and the trends tell you where the business is strengthening or weakening. When you’re considering a hire, a price change, or a new expense, model it into a forward-looking P&L before committing. The P&L isn’t just a report card; it’s a planning tool if you use it that way.
Yes. Even a solopreneur with $50K in annual revenue benefits from producing and reading a P&L monthly. It’s the single clearest measure of whether the business is working economically. And if you ever apply for a loan, seek investors, sell the business, or file more complex taxes, historical P&Ls are what everyone will ask for first.